|
|
Pan-Cancer Proteogenomic Network Analysis Uncovers Immune Microenvironment and Prognostic Biomarkers发表时间:2025-08-03 17:58 Abstract Pan-cancer analysis provides valuable insights into commonand distinct molecular mechanisms across various cancer types. Co-expressionnetworks, which captured the cordinated expression of genes and proteins, offerpotentials for identifying robust biomarkers and targeted therapies. However,current-existing co-expression construction method involves either RNA orProtein data in isolation, limiting our understanding on multi-perspectiveinteractions in cancer. To address this gap, we integerated both the RNA andProtein data to constrcut a comprehensive pan-cancer co-expression network,combining both gene and proteomic layers of information across cancer types.This approach enables the identification of previously undetected co-expressionrelationships, highlighting key regulatory patterns in cancer analysis. Ourstudy constructed a multi-perspective co-expression network, after that, weidentified several conservation modules and compare the modules identified fromRNA and Protein. We found out that the conservation modules identified differsignificantly from RNA and Protein data. However, there are certain sharedconservation modules, especially those related to IFN-gamma, IFN-alpha, and theactivation of JAK_STAT. Then we identified several important immune-relatedpathways using RNA and Protein data and uncovered some modules with highprognostic value across cancers. As a novel pan-cancer analysis approach, itholds promise for advancing future cancer research, from the discovery of novelbiomarkers to the design of personalized cancer therapies, thereby enablingmore thorough and holistic cancer analysis.
Key Words: pan-cancer,co-expression network, prognostic analysis, immune pathways
Tableof Content:I. Introduction
II. Method
III. Result
IV. Discussion
V. Acknowledgement
VI. References
Introduction As one of the most complex, dynamichuman diseases, cancer’s complexity stems from its multifaceted nature,encompassing genetic, epigenetic, and environmental factors. At the geneticlevel, cancer involves mutations in a wide range of genes, leading to diverseand unpredictable responses in patients.[1] Additionally, the interactionbetween cancer cells and the microenvironment (TME) complicates the situation[2] by dysregulating the cell-cell interaction pathways. Epigeneticmodifications also play a crucial role, modifying the gene expression withoutchanging the DNA sequence[3] and contributing to the unpredictability oftumors. This intricate network of factors makes cancer a highly complex andheterogeneous disease, challenging both diagnosis and treatment. Meanwhile,biological network analysis offers significant advantages in tumor research byproviding a systematic view of the complex interactions [4]within thebiological system. By mapping out networks of genes, proteins, and othermolecules, researchers can identify crucial nodes and pathways involved incancer and gain insight into how disruptions in one part of the network[5]might impact other components. Therefore, leveraging systematic biologicalnetwork analysis in pan-cancer research allows for a more comprehensive andholistic approach to tackling this complex disease. According to the existingexperimental conclusions, most studies have focused on building theco-expression network based on RNA-seq data. However, recent advancements inproteomics have revealed that the correlation of mRNA and protein is oftenlower than anticipated[6] due to factors like translation and transcriptionmodifications. Therefore, more than building a co-expression network relyingentirely on RNA-seq data is required for a comprehensive and targeted tumoranalysis. Fortunately, the newly developed database provides us with anextensive range of proteome information, allowing us to build a more preciseco-expression network based on the proteome data to capture a more accuraterepresentation of biological processes and interactions. [7] Prognostic analysis is crucial forpredicting disease outcomes, guiding treatment decisions, and improving patientmanagement. [8]Accurate prognostic assessments can enhance the effectiveness ofmedical intervention and increase individual patients’ particularizability[9].Integrating network analysis into prognosis research provides a significantadvantage by uncovering complex interactions among genes, proteins, and othermolecules. By constructing and analyzing the co-expression network, researcherscan identify vital prognostic components in the network and their roles inregulating specific mechanisms in cancer. Currently, no such research aboutnetworks based on large-scale proteome data and their corresponding prognosisis available for applications in cancer analysis. Therefore, in our study, wefocus on building a precise proteome-based co-expression network that helpswith prognosis analysis, and we believe that our study will not only improvethe precision of prognostic prediction[10] but also reveal potential targetsfor therapeutic interventions. The modules within biologicalnetworks are often linked to specific phenotypes, making them valuable toolsfor understanding the underlying mechanisms of diverse disease cases.[11]Researchers can uncover the connection between network modules and certainphenotype expressions by systematically searching for different phenotypes,such as the immune cell abundance. This approach is crucial for identifyingcritical regulatory pathways and potential therapeutic targets, ultimatelyleading to a more comprehensive understanding of disease causation andeffective treatment strategies. Therefore, our research focuses onconstructing a cancer co-expression network based on large-scale proteome data,providing a more comprehensive understanding of the molecular interactionsinvolved in cancer. We holistically describe co-expression networks andprognostic modules in cancer and reveal multiple regulatory mechanisms relatedto cancer prognosis. Further, our network serves as avaluable tool for evaluating the conservation of these modules and genes acrossdifferent cancer types. It enlightens researchers with the underlyingconservation patterns shared by different tumors. Ultimately, our work canpotentially guide future therapeutic strategies by revealing conservedbiological processes that influence tumor behavior across the cancer spectrum.
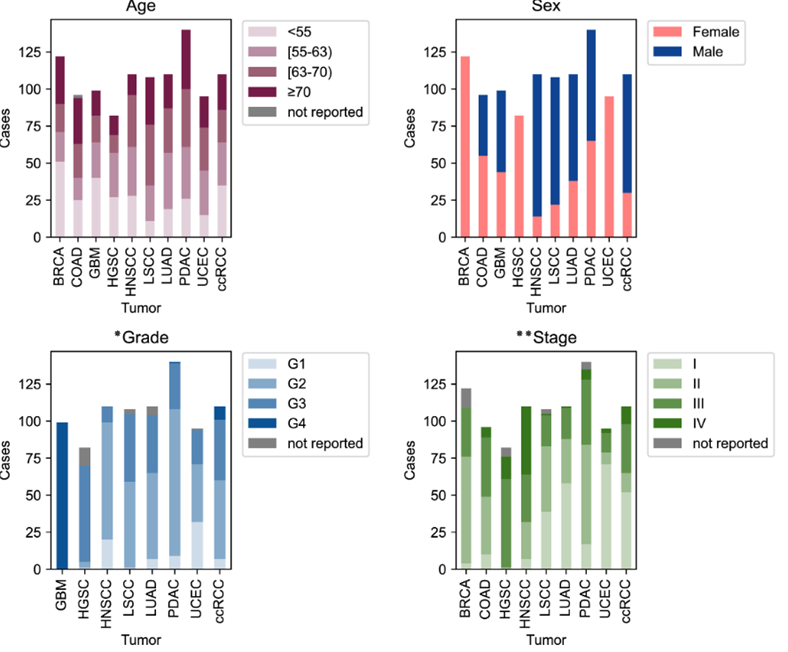
Method Clinicaland molecular data sets The proteomics data used inthis study were obtained from the Clinical Proteomic Tumor Analysis Consortium(CPTAC), which has characterized over 1,000 treatment-naïve primary tumorsspanning 10 different cancer types. The cancer types included in the CPTACdataset are breast cancer (BRCA), ovarian cancer (OV), colon cancer (COAD),clear cell renal cell carcinoma (ccRCC), uterine corpus endometrial carcinoma(UCEC), lung adenocarcinoma (LUAD), liver hepatocellular carcinoma (LIHC),glioblastoma multiforme (GBM), pediatric brain tumors (PBT), and pancreaticcancer (PAAD). In total, we collected proteomic, RNA, and phenotypic data from1,043 cancer patients across these 10 cancer types. For proteomics data, massspectrometry-based proteomic profiling was employed, using label-freequantification to measure protein expression levels. The data were furtherprocessed with normalization and batch correction to remove technicalvariability, ensuring accurate cross-sample comparisons. Specifically, wedownloaded RNA-seq data at the gene level, processed using the RSEM (RNA-Seq byExpectation-Maximization) algorithm, ensuring high-quality and reliablequantification of gene expression. The dataset covers acomprehensive range of phenotypes, including clinical factors such as age, BMI,sex, histologic grade, tumor stage, overall survival, progression-freesurvival, and tumor size, offering insight into patient prognosis. Immunephenotypes are analyzed using tools like CIBERSORT and xCell, providingestimates of various immune cells (e.g., B cells, T cells, macrophages, NKcells, neutrophils, monocytes) within the tumor microenvironment. Additionally,hallmark pathways (e.g., inflammatory responses, hypoxia) and mutationsignatures (e.g., SBS1, APOBEC) contribute to understanding the molecularmechanisms of cancer progression, supported by ImmuneScore and StromalScoredata on tumor-immune interactions.
Co-expressionnetwork construction The co-expression network wasconstructed using the WGCNA package in R(4.4.1), which is a systematic softwarepackage for analyzing and constructing gene networks across diverse state orcondition samples. The following steps outline the process of networkconstruction with detailed parameter settings: We utilized the WGCNA packagein R to construct a gene co-expression network from normalized log-transformedgene expression and protein data. The analysis commenced with data preparation,where gene identifiers were truncated, and gene symbols were integrated throughannotation. Subsequently, genes were filtered based on their median absolutedeviation (MAD), retaining those with MAD greater than the 50th percentilevariability. Samples and genes with excessive missing values were excludedbased on the output from goodSamplesGenes. The network constructioninvolved determining a soft thresholding power using the scale-free topologymodel fit, targeting an R^2 value of 0.85 for optimal network representation.We employed the "unsigned" network type, allowing for the considerationof both positive and negative correlations. Module detection was performedusing the blockwiseModules function with a merge cut height of 0.25, ensuringthe identification of distinct gene co-expression modules. The minimum modulesize was set to 30 genes to maintain biological relevance. For visualization, modulecolors were assigned, and a heatmap of the gene dendrogram was created. Moduleeigengenes (MEs) were calculated and used to generate an adjacency heatmap toexplore module relationships. The network heatmap was constructed, highlightinggene-to-gene connections with enhanced visibility for moderately strong linksthrough power transformation. Phenotypic data integrationallowed us to correlate module eigengenes with clinical traits using eitherPearson correlation. The resulting correlations were visualized, andsignificant associations were identified. Genes were further analyzed for theirassociation with phenotypic traits, pinpointing those with high modulemembership and significant trait correlation, potentially highlighting keygenes of biological importance. Identifyconserved modules. To explore the conservationbetween modules, we introduced the Jaccard index for assessment. This involvedcomparing the genes within modules of one cancer type to the network modulespresent in other cancer types. The similarity between each pair of modules wasquantified using the Jaccard index, which is calculated based on the genes fromthe respective modules, denoted as set A and set B. To investigate theconservation between modules, we employed the Jaccard index for assessment.Initially, we evaluated the conservation of modules identified from RNA andprotein data within the same cancer type. Subsequently, we computed thepairwise module similarity across all cancer types for networks constructedfrom protein data and RNA data, respectively. Finally, we identified clustersof highly conserved modules through hierarchical clustering Moduleannotation and prognosis analysis To understand the functionsaffected by genes within each module, we performed functional annotation of themodules. On one hand, we calculated the relationship between module eigengenesand phenotypes using WGCNA. On the other hand, we conducted enrichment analysisusing the clusterProfiler R package, based on GO, KEGG, and Reactome databases.We corrected the p-values for FDR and retained only those terms with FDR <0.05 and ranked in the top 5 within each database. To assess the relationshipbetween modules and prognosis, we performed survival analysis for each module.We obtained the batch effects normalized mRNA data and survival data from theTCGA Pan-Cancer (PANCAN) database. For each module, we conducted PCA on all thegenes and extracted PC1 to use as a grouping criterion, dividing the samplesinto PC1 high-expression and PC1 low-expression groups. To test whether theexpressions of module eigengenes significantly affect survival time (P <0.05), we built a Cox proportional-hazard model using the R function “coxph.”The hazard ratio reflects how expression levels influence the rate of patientsurvival, where an increase in the death hazard corresponds to a decrease insurvival length. Additionally, we conducted the same analysis considering allcancer samples as a whole.
Result Pan-cancer co-expression networks and modules We performed WGCNA analysis on ten types of cancer based on RNA data andprotein data, constructing ten protein co-expression networks and ten RNAco-expression networks. To identify key gene interactions, we retained only thetop 50% of genes by median absolute deviation (MAD) from the protein data fornetwork analysis. Through hierarchical clustering, numerous modules wereidentified from each network, with specific results presented in Table 1.
Table 1: Thenumber of genes used to construct the pan-cancer network and the number ofmodules identified. The scientific question that initially concerned us was whether there aredifferences between networks constructed based onprotein data and RNA data. Therefore, we assessed the conservation ofmodules identified by networks built from different data types within the sametype of cancer using the Jaccard index. It is noteworthy that we used the sameset of genes to construct networks of different data types. The results showedthat the modules identified by networks built from different data types wereextremely non-conservative, with an average Jaccard index of 0.04 and thehighest Jaccard index was 0.65(Figure 1A). Moreover, this non-conservatism isshared across different types of cancer(Figure 1B). This suggests that whenstudying biological processes through interaction networks, multiple datasources must be considered simultaneously.
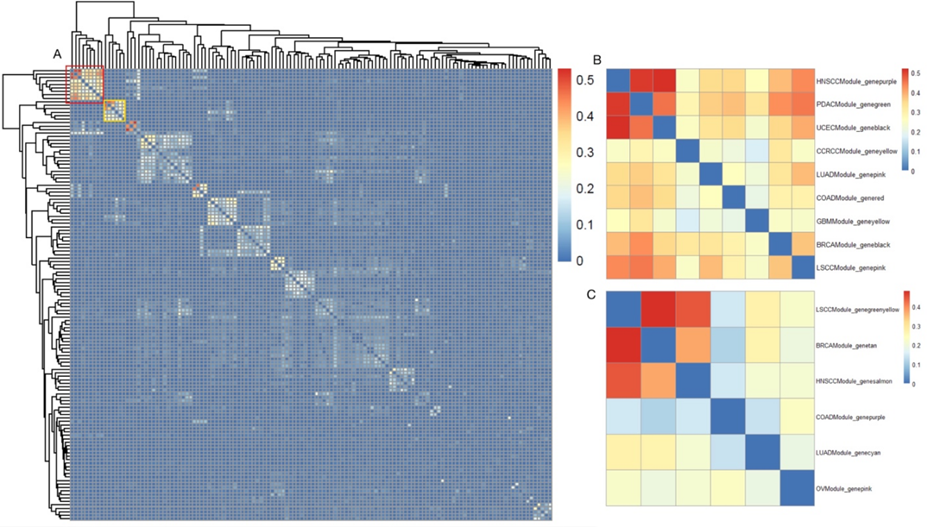
Figure 1:Thedistribution of Jaccard Index between modules constructed based on protein dataand RNA data Identify pan-cancerpreserved modules We did the preserved analysis ofproteins in between modules and different cancers (Fig. 2A) and found the conserved part in pan-cancer. Amongthem, cluster 1 (Fig. 2B) contains9 cancers—HNSCC, PDAC, UCEC, CCRCC, LUAD, COAD, GBM, BRCA, and LSCC; andcluster 2 (Fig. 2C) contains6 cancers—LSCC, BRCA, HNSCC, COAD, LUAD, and OV. Among them, the main functionof the cluster module is focused on the final culmination in the formation ofthrombin, the enzyme responsible for the conversion of soluble fibrinogen tothe insoluble fibrin clot[11]; and for cluster 2, it is mainlyfocused on defense response to the virus, which is the reactions[12] triggered in response to the presenceof a virus that acts to protect the cell or organism. Figure.2: Conservation analysis of proteins in between modulesof different cancers. (A) Conservationanalysis of proteins in all modules of different cancers, where the colorintensity represents the conservation level on the scale of 0 to 0.5; the redblock refers to Figure 2B and theyellow block refers to Figure 2C. (B)Conservation analysis of proteins of different modules in 9 of the cancers.Rows represent the various modules in 9 cancers, and the color intensityrepresents the conservation level on the scale of 0 to 0.5. (C) Conservationanalysis of proteins of different modules in 6 of the cancers. Rows representthe different modules in those 6 cancers, and the color intensity representsthe conservation level on the scale of 0 to 0.5.
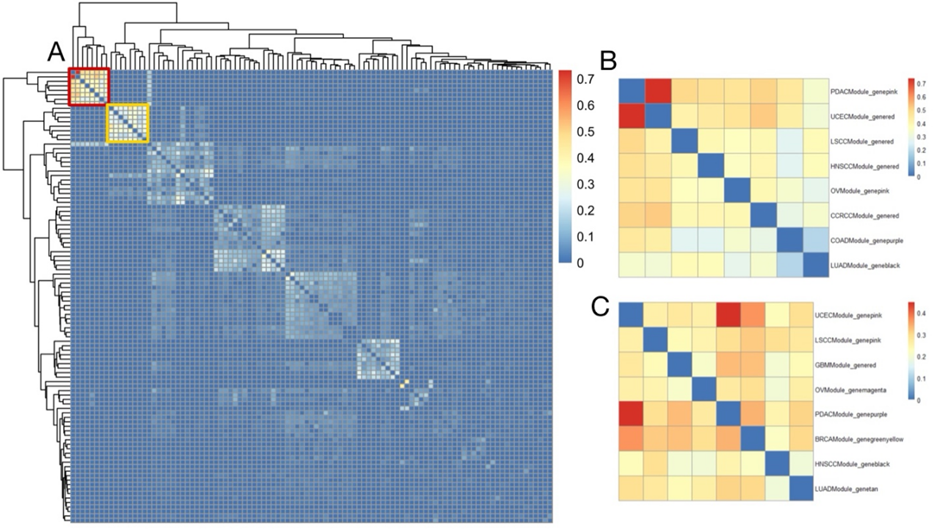
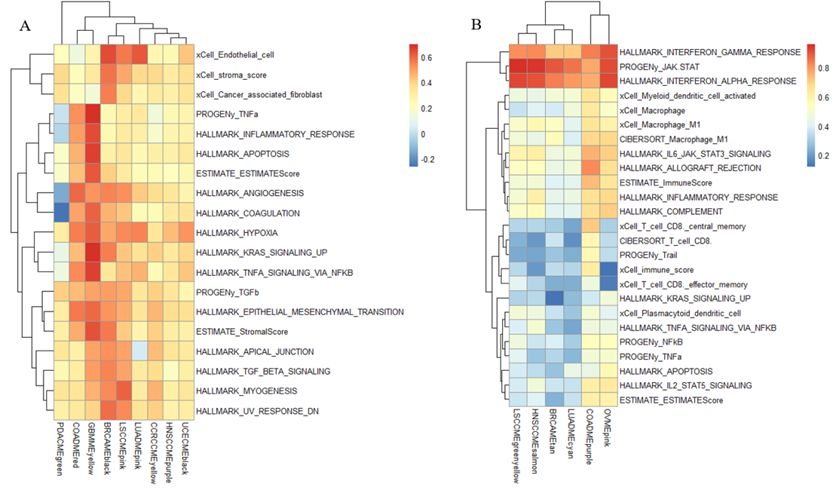
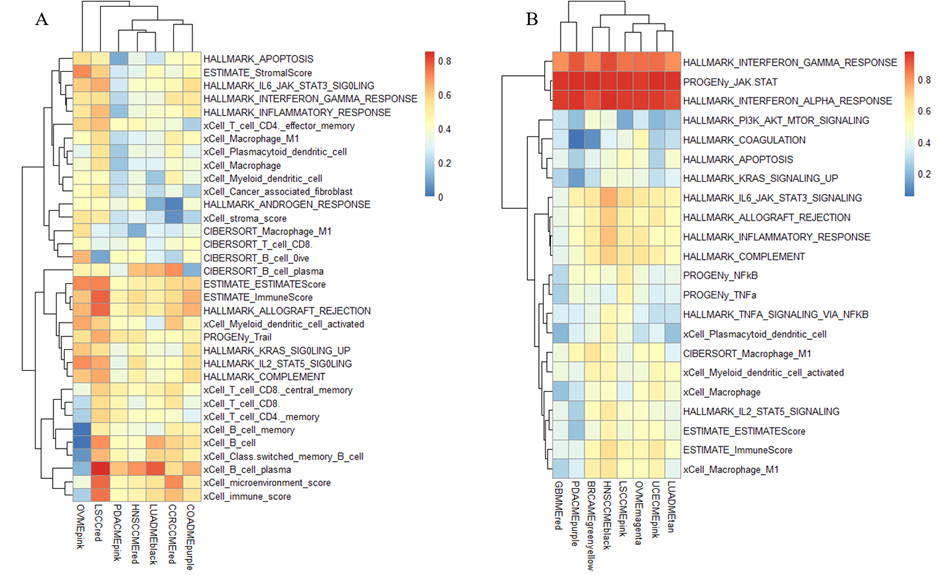
Figure 3:Conservation analysis of RNAs in between modules of different cancers. (A) Conservationanalysis of RNAs in all modules of different cancers, where the color intensityrepresents the conservation level on the scale of 0 to 0.7; the red blockrefers to Figure 3B and theyellow block refers to Figure3C. (B)Conservation analysis of RNAs of different modules in 8 of the cancers. Rowsrepresent the various modules in 8 cancers, and the color intensity representsthe conservation level on the scale of 0 to 0.7. (C) Conservation analysis ofRNAs in different modules in 8 of the cancers. Rows represent the differentmodules in those 8 cancers, and the color intensity represents the conservationlevel on the scale of 0 to 0.4. We did the preserved analysis ofproteins in between modules and different cancers (Fig. 3A) and found the conserved part in pan-cancer. Amongthem, cluster 1 (Fig. 3B) contains9 cancers—PDAC, UCEC, LSCC, HNSCC, OV, CCRCC, COAD, and LUAD; and cluster 2(Fig. 3C) contains8 cancers—UCEC, LSCC, GBM, OV, PDAC, BRCA, HNSCC, and LUAD. In regard tocluster 1, thefunction of the modules primarily concentrates on immunoglobulin production,which allows the immune system to recognize and effectively respond to a myriadof pathogens[13]; cluster 2, similar to cluster 2 in protein, focuses on thefunction of defense response to the virus. Functions Impacted by Preserved Pan-Cancer Modules As shown inFigure 4A Protein cluster 1 can beidentified that hypoxia is highly related to several protein clusters, with thehighest average relationship value of 0.48. Here, hypoxia represents acondition where tissues experience low oxygen levels, and it drives severalprocesses that promote cancer progression in the tumor microenvironment. Thisis mainly because hypoxia promotes abnormal, yet excessive, blood vesselformation and triggers the epithelial-to-mesenchymal transition (EMT)phenotype, which enhances cell movement and metastasis. Additionally, hypoxiamodifies cancer cell metabolism and supports therapy resistance by inducing aquiescence state in the cell. [12] As part of the cause of hypoxia, theepithelial-to-mesenchymal transition is the second highly related phenotype tothe protein clusters, with an average relationship value of 0.45. This ismainly because EMT can enhance the ability of cells to invade the surroundingtissues. [13] Other phenotypes with relatively high relationship scores aremyogenesis, KRAS signaling up, stromal score, and the activation of the TGFbpathway, all with a relationship score above 0.4. According to the data ofProtein cluster 2 (Fig 4B), we canconclude that the activation of the JAK-STAT pathway has the highestrelationship with the protein clusters, with an average relationship value of0.89. This phenomenon is primarily because the activation of the JAK_STATpathway often drives cancer cell proliferation and metastatic behaviors. [14]Thephenotype with the second highest relationship value is the dysfunction ofinterferon-alpha- response (IFN-alpha), with a relationship score of 0.86. TheIFN-alpha can partly cause tumors because it induces cell apoptosis. [15] Otherphenotypes closely related to the clusters in protein 2 are INF-gamma, JAK-STATsignaling, allograft rejection, inflammatory response, complement,macrophage-M1, immune score, and myeloid dendritic cell activated, all with arelationship score above 0.5.
Figure 4:Characterization of conserved module clusters based on protein data.(A) Biological functions of protein cluster 1. (B) Biologicalfunctions of protein cluster 2. Moving on to the RNA data, we canconclude that in RNA cluster 1(Figure 5 A), the phenotype with the highest relationship with theclusters is the B cell plasma, with a relationship score of 0.61. Recent datashows that B cell plasma is located in tumors, and the dysfunction of the Bcell plasma can produce specific antibodies that drive distinct immuneresponses. [16]Another noticeable phenotype shown in RNA 1 is the immune score,with a relationship score of 0.59. This is relatively understandable since thecancer cells can reduce the expression of molecules (like MHC class I proteins)that present abnormal proteins (antigens) to immune cells, making it harder forT-cells to recognize them as dangerous. Other phenotypes with relatively highcorrelation with the RNA clusters are allograft rejection, microenvironmentscore, Il2-STAT5-signaling, trail, and complement, all with a correlation valueabove 0.5. Similarly, according to the data in RNA cluster 2(Figure 5 B), it can be identified that theactivation of the JAK_STAT pathway and INF-alpha are the two phenotypes withthe highest correlation to the clusters, ranking 0.95 and 0.86 respectively. Otherphenotypes with relatively high correlation are IFN-gamma,IL6_JAK_STAT3_signaling, inflammatory response, complement, allograftrejection, and immune score, all with a correlation score above 0.5.
Figure 5:Characterization of conserved module clusters based on RNA data.(A) Biological functions of protein cluster 1. (B) Biologicalfunctions of protein cluster 2.
Now, it is shown that the network based on theprotein and RNA databases shares certain similarities. As shown in both thegraph of protein2 and RNA2, both recognize that IFN-alpha, IFN-gamma, and theactivation of JAK_STAT are of high correlation with the clusters, indicatingthat these are the shared characteristics of cancer. However, there are also significantdifferences between the network based on RNA and protein. In protein 1, hypoxiais highly signified as a typical phenotype shared by many cancer modules, suchas the GBM(MEyellow), LUAD(MEpink), and COAD(MEred). Meanwhile, RNA1 showcases nothing aboutthese module clusters, and hypoxia isn’t highlighted as a representativephenotype shared by the modules. Similarly, the EMP is also a phenotype sharedbetween the cancer modules according to protein 1, yet no evidence is shown inRNA1. The same thing happens to the myogenesis and KRAS signal. Yet the RNAdata also reveals some phenotypes shared between the modules and not recognizedby the protein 1 data. In RNA 1, the B cell plasma is highly correlated to themodules. Still, in protein 1, this phenotype only has a relationship score of-0.02, signifying the differences in the analysis result from the two data. Asimilar situation also falls on the phenotypes of allograft rejection,microenvironment score, IL2_TAT5 signaling, and trail, where these phenotypesare only recognized as shared phenotypes in RNA1 but no related signs inprotein1. The data can also be used to analyze the groupclusters of these cancer modules. From the graph of protein1, we can concludethat COAD(MEred), GBMM(MEyellow), BRCA(MEblack), and LSCC(MEpink) can be divided into the same group,exhibiting a relatively high correlation with almost all the phenotypes shownin the graph. In contrast, LUAD(MEpink), CCRCC(MEyellow), HNSCC(MEpurple), and UCEC(MEblack) can be divided into another group, exhibitinga relatively low correlation with the phenotypes compared to the previousgroup. From the graph of protein2 provided, we can conclude that the LSCC(MEgreenyellow), HNSCC(MEsalmon), BRCA(MEtan), and LUAD(MEcyan) can be divided in thesame group, exhibiting little correlation with the last eight phenotypes shownin the graph; meanwhile, COAD(MEpurple) and OV(MEpink) can be divided in another group, exhibitingcertain level of correlation with the eight phenotypes at the back shown in thegraph. From the graph of RNA1, we can divide the group by putting LSCC(red) separately in onegroup. In contrast, the rest of the modules are divided into another groupsince they aren’t correlated to every phenotype shown in the graph. Still, theLSCC(red) module showcases acertain level of correlation with every phenotype shown in the graph. From thegraph of RNA2, all the modules exhibit relatively similar correlations with thephenotypes, with high relationships between IFN-alpha and IFN-gamma and theactivation of JAk_STAT. Therefore, it is better to put all the modules in RNA2in the same group because of their resemblance in the correlation pattern.
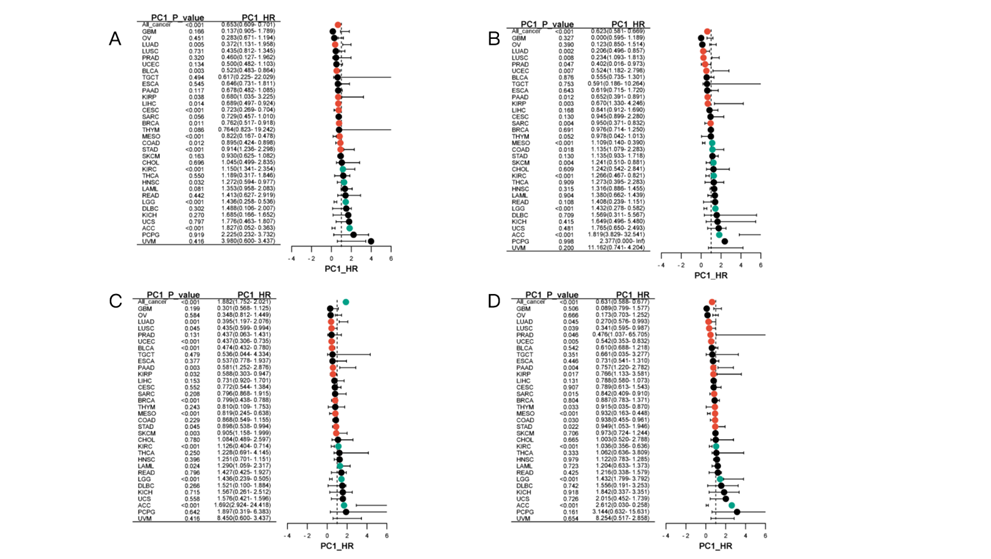
Theprognostic features of conserved module and immune related module To elucidate the prognostic patternsof the identified modules, an extensive investigation was conducted to evaluatetheir prognostic significance across various cancers. The analysis focused onassessing the differential prognostic value of these modules, revealing fourwith particularly high prognostic relevance based on RNA and protein data. According to the protein data, theBRCA (MEpink) (Fig.4A) and COAD(MEyellow) (Fig.4B) modulesexhibited strong prognostic value across 15 different cancer types, as shown inthe forest plots below. This suggests that these modules may play key roles inpredicting disease outcomes in a wide range of cancers. Meanwhile, based on theRNA data, the BRCA (MEquoiseCox) (Fig.4C) and LUAD (MEbrown) (Fig.4D) modulesemerged as highly prognostic across 16 cancers, further highlighting theirpotential as important biomarkers for cancer prognosis, as also depicted in theaccompanying forest plots.
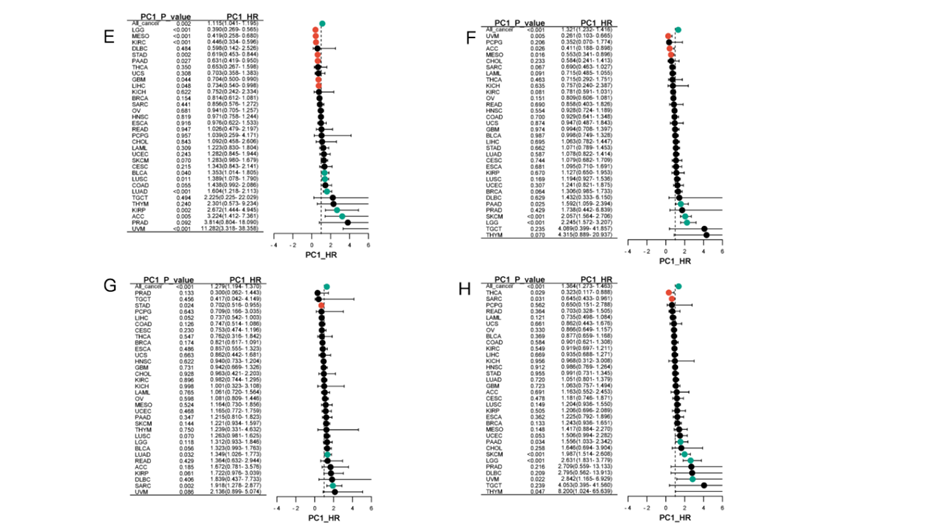
Fig. 6: Forest figures presenting the prognostic functions ofthe modules The figures displayed are with a 95% condifenceinterval of the result. (A) is the forest figure forBRCA(MEpink), (B) is the forest figure for COAD(MEyellow), figure 5(C) is the forest figure for BRCA(MEquoiseCox) and (D)is the forest figure for LUAD(MEbrown). (E) the forest graph showing theprognostic value of the protein cluster1, the red module of the cancer COAD.(F) the forest graph showing the prognostic value of the protein cluster2, brown module of the cancer OV. (G) the forestgraph showing the prognostic value of the RNA cluster1, the pink module of thecancer OV. (H) the forest graph showing the prognostic value of RNA cluster2,the greenyellow module of the cancer BRCA. (I) the forest graph showing theprotein immune related red module of the cancer GBM. (J) the forest graphshowing the RNA immune related brown module of the cancer OV. In addition to the between-groupanalysis for the modules, we also conducted a within-group analysis by focusingon the HR values and drawing a forest plot. In the protein analysis, we foundthat COADMEred (Fig. 4E) and OVMEpink (Fig. 4F), belonging to cluster1 andcluster2 respectively, have strong prognostic values as shown in the followingfigures. Meanwhile, in RNA, OVMEpink (Fig. 4G) and BRCAMEgreenyellow (Fig. 4H),belonging to cluster1 and cluster2 respectively, also performed strongprognostic values. Discussion Our research offers a comprehensiveexploration of the pan-cancer co-expression network using both the RNA and theProtein data, leading to significant findings on module conservation andprognostic implications. By constructing co-expression networks, we were ableto identify several distinct modules that reflect the underlying biologicalprocesses in cancer. One key finding is the highlighted difference for thedistinct modules identified from RNA and protein within the same cancer types,emphasizing the importance of analyzing both networks when conductingtherapeutic research on cancer. In terms of module conservation,although our analysis revealed remarkable differences between modules, thereare certain conserved modules at the pan-cancer level, particularly thoserelated to IFN-gamma, IFN-alpha, and the activation of JAK_STAT. Furthermore,our evaluation of immune-related modules underscores the importance of immunepathways in cancers. Several modules were found to be related to immunepathways, such as the BRCA(MEred), COAD(MEpurple), CCRCC(MEgreen), GBM(MEblue),LSCC(MEturquoise), and HNSCC(MEblue). The finding of these immune pathwaysreflect the significant role of the immune microenvironment in shaping thecancer outcomes. Finally, the research delved intothe relationship between these identified modules and cancer prognosis. Weuncovered several prognostic modules using both the RNA and Protein data, suchas the BRCA(MEpink), COAD(MEyellow), BRCA(MEquoisecox), and COAD(MEyellow)identified in Result 4. Interestingly, some of the conserved and immune-relatedmodules also demonstrated prognosis relevance, suggesting that these modulesmight not only uncover the biological processes behind the cancers but alsopredict future outcomes for the patients. Our findings mark a significantdeparture from conventional analysis methods, where a single data type,especially the RNA data, is used to infer the gene and protein interaction innetwork analysis. By incorporating both the RNA and the Protein data derivedfrom the same sample, our study uncovers the complexity and unpredictability ofcancer co-expression networks. The significant differences between modulesidentified by RNA and Protein suggest that these two aspects capture distinctbiological processes. While RNA provides a snapshot of gene expression level,Protein reflects the modification during translation and transcription,signifying cancer network dynamics. The differences observed with RNAand Protein data also signify the limitation of using solely one type of datafor network construction. RNA-based networks, while reflecting the cancercharacteristics at the gene expression level, might misidentify the processesundergoing on the protein level. Similarly, protein-based networks canaccurately reflect the processes happening on the protein level but mightoverlook the transcriptional modification captured in RNA data. Therefore, ourstudy underscores the necessity of integrating multi-perspective sources toconstruct more comprehensive and representative interactive networks. Building on the findings of RNA andprotein-based network analysis, this study’s future applications are vast,particularly in personalized medicine and targeted cancer therapies. Theidentified conservative, immune-related, and prognostic modules are newlydiscovered and can be potential targets for future cancer research. Thisdual-perspective research can be instrumental in finding novel biologicalmarkers that are not detected by RNA or Protein data alone, providing a morecomprehensive view of pan-cancer analysis. Specifically, some of the potentialapplications of this approach can be predicting patient-specific responses tocertain therapies and promote the development of combined therapies towardinteraction between immune and cancer cells, both in RNA level andtranscriptional level. By using both data types, clinicians could designpersonalized treatment plans that target not only the gene expression but alsothe proteomic activities for cancer patients. In conclusion, the integration ofRNA and protein-based pan-cancer network construction provides a powerful toolfor addressing complex challenges in cancer treatment. It has the potential toguide future cancer analyses from novel biomarkers to personalized cancertherapies, paving the way for more comprehensive and accurate cancer analysis. Acknowledgement In one of our elective courses:synthesis biology, when our instrcutor Jia You was explaining the process ofthe formation of protein, she mentioned that even though RNA serves as theguide for protein, there can exist unpredictable modification in the folding ofprotein. Therefore, the result based on RNA data and Protein data can sometimesbe distinct in complex studies. Thinking of the most dynamic and complexbiological challenge currently in the world, cancer analysis is undoubtly worthnoticing. We then came up with the idea of doing cancer analysis using both theRNA and Protein data, trying to uncover some previously undected discoveries.After many intense discussions with our instructor, Ms. You advised us toconsider biological challenges systematically, instead of solely understandeach individual molecule which might lead to interpretation biases such asoverlooking the significance of a single gene. In terms of cancer, a biologicalissue involving multiple aspects and con’t be easily divided into a singlecolumn, we eventually decided to construct a co-expression network touncover the complex interactions betweendifferent modules.
In our study, Wenhan Shi is mainly in charge of formalanalysis, programming, paper-searching, writing–original draft, writing–reviewand editing; while Runing Guan is in charge of data collection, programming,paper-searching, writing–original draft, writing–review and editing.
We would like to deliever oursincere thankfulness to our instructor Jia You, the teacher of biology and theelective course of synthesis biology, for her kind advises and instructions ontopic choosing. She didn’t receive any reward from the author.
We would also like to express ourthank to the Sponsors of Qiu Chengtong academic competition, for they providedus with a broader stage to share our research and we’ve learned a lot aboutbiological tecnology throughout our research.
At last, we would like to expressour sincere gratefulness again to everyone who supported and helped us.
References [1]Mathew J. Garnett, Ultan McDermott, Exploiting genetic complexity incancer to improve therapeutic strategies, Drug Discovery Today, Volume 17,Issues 5–6, 2012, Pages 188-193, ISSN 1359-6446, https://doi.org/10.1016/j.drudis.2012.01.025. [2]Kamińska, Katarzyna, et al. “The Role of the Cell-Cell Interactionsin Cancer Progression.” Journal ofCellular and Molecular Medicine, U.S. National Library of Medicine, Feb.2015, www.ncbi.nlm.nih.gov/pmc/articles/PMC4407603/. [3]Kanwal, R., and S. Gupta. “Epigenetic Modifications in Cancer.” Clinical Genetics, vol. 81, no. 4, Dec.2011, pp. 303–11. https://doi.org/10.1111/j.1399-0004.2011.01809.x. [4]Sun, Kai, et al. “Predicting Disease Associations via BiologicalNetwork Analysis.” BMC Bioinformatics,vol. 15, no. 1, Sept. 2014, https://doi.org/10.1186/1471-2105-15-304. [5]YuD, Kim M, Xiao G, Hwang TH. Review of biological network data and itsapplications. Genomics Inform. 2013 Dec;11(4):200-10. doi:10.5808/GI.2013.11.4.200. Epub 2013 Dec 31. [6]Maier,Tobias, et al. “Correlation of mRNA and Protein in Complex Biological Samples.”FEBS Letters, vol. 583, no. 24, Oct.2009, pp. 3966–73. https://doi.org/10.1016/j.febslet.2009.10.036. [7]XuP, Zhang B. Multiscale network modeling reveals the gene regulatory landscapedriving cancer prognosis in 32 cancer types. Genome Res. 2023Oct;33(10):1806-1817. doi: 10.1101/gr.278063.123. Epub 2023 Oct 31. [8]Halabi S,Owzar K. The importance of identifying and validating prognostic factors inoncology. Semin Oncol. 2010 Apr;37(2):e9-18. doi:10.1053/j.seminoncol.2010.04.001. [9]Mackillop,William J. “The Importance of Prognosis in Cancer Medicine.” TNM Online, July 2006, https://doi.org/10.1002/0471463736. [10]Ma,S., Shi, M., Li, Y. et al.Incorporating gene co-expression network in identification of cancer prognosismarkers. BMC Bioinformatics11, 271 (2010). https://doi.org/10.1186/1471-2105-11-271 [11]KEGG_COMPLEMENT_AND_COAGULATION_CASCADES.www.gsea-msigdb.org/gsea/msigdb/cards/KEGG_COMPLEMENT_AND_COAGULATION_CASCADES [12] DefenseResponse to Virus Gene Ontology Term (GO:0051607). www.informatics.jax.org/vocab/gene_ontology/GO:0051607. [13] Jackson,David, and Sherine Elsawa. “Factors Regulating Immunoglobulin Production byNormal and Disease-Associated Plasma Cells.” Biomolecules, vol. 5, no. 1, Jan.2015, pp. 20–40. https://doi.org/10.3390/biom5010020. [14]MODULE COVER– A NEW APPROACH TO GENOTYPE-PHENOTYPE STUDIES YOO-AH KIM (USA), RAHELEHSALARI (USA), STEFAN WUCHTY (USA), and TERESA M. PRZYTYCKA (USA) Biocomputing2013. November 2012, 135-146 [15]MuzB, de la Puente P, Azab F, Azab AK. The role of hypoxia in cancer progression,angiogenesis, metastasis, and resistance to therapy. Hypoxia (Auckl). 2015 Dec11;3:83-92. doi: 10.2147/HP.S93413. [16]Roche J. TheEpithelial-to-Mesenchymal Transition in Cancer. Cancers (Basel). 2018 Feb16;10(2):52. doi: 10.3390/cancers10020052. Erratum in: Cancers (Basel). 2018Mar 19;10(3):E79. doi: 10.3390/cancers10030079. [17]Brooks AJ,Putoczki T. JAK-STAT Signalling Pathway in Cancer. Cancers (Basel). 2020 Jul20;12(7):1971. doi: 10.3390/cancers12071971. [18]Shi W, Yao X,Fu Y, Wang Y. Interferon-α and its effects on cancer cellapoptosis. Oncol Lett. 2022 May 30;24(1):235. doi: 10.3892/ol.2022.13355. [19]Sharonov, G.V., Serebrovskaya, E.O., Yuzhakova, D.V. et al. B cells, plasma cells andantibody repertoires in the tumour microenvironment. Nat Rev Immunol 20, 294–307 (2020). |
|||||||||||||||||||||||||||||||||||||||||||||||||||||||||||